Antilatency.
Antilatency.Pillar.App is a diagnostic program designed for an end-to-end check of all the Antilatency Pillars systems. Diagnostic data collected goes to a separate file the users can work with on their own to fix the errors found. This file can also be sent to the technical support team for later diagnostics.
This program is compatible with Windows operating system and does not need any additional software.
In this article
Installation
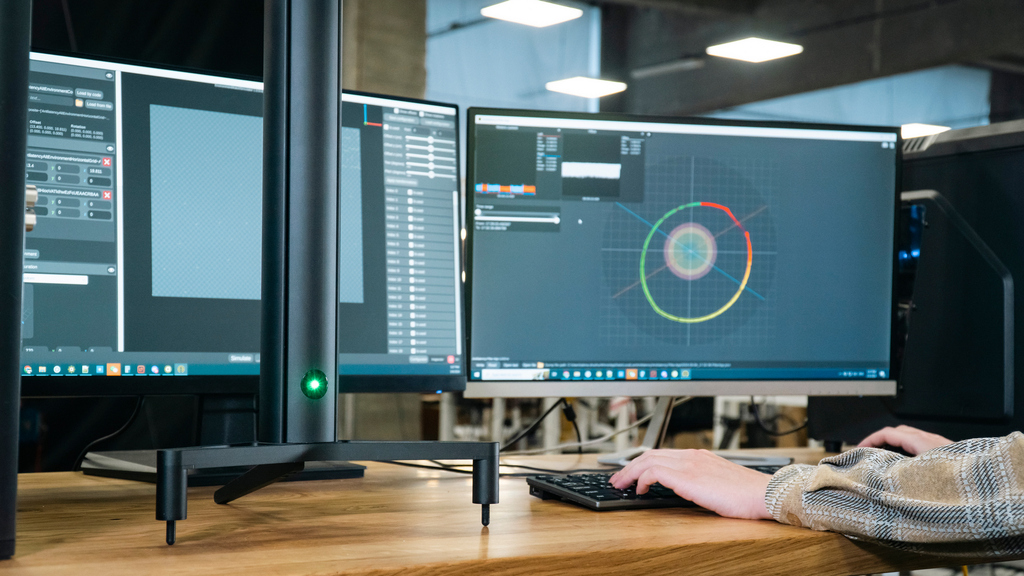
Download Antilatency.Pillar.App and run the installer Antilatency.Pillar.App.exe. Connect Antilatency Pillar to your device.
The program works with only one pillar at a time. The necessary firmware version of Antilatency Pillar is — 3.0.0.
If a pillar has been connected successfully, an RGB LED indicator on its top will light up. You will also see a marker that shows the position of a magnet inside a pillar. The main function of a magnet is to calibrate an upright position of a pillar.
Windows with additional parameters will pop up at the top of the screen.
Windows with additional parameters will pop up at the top of the screen.
Pay attention to the quality of your USB cable: it must be designed to carry a current of 1.5 A. If the program works correctly, the value in the Mean line in the VBus window will vary between 4.8 V and 5.1 V.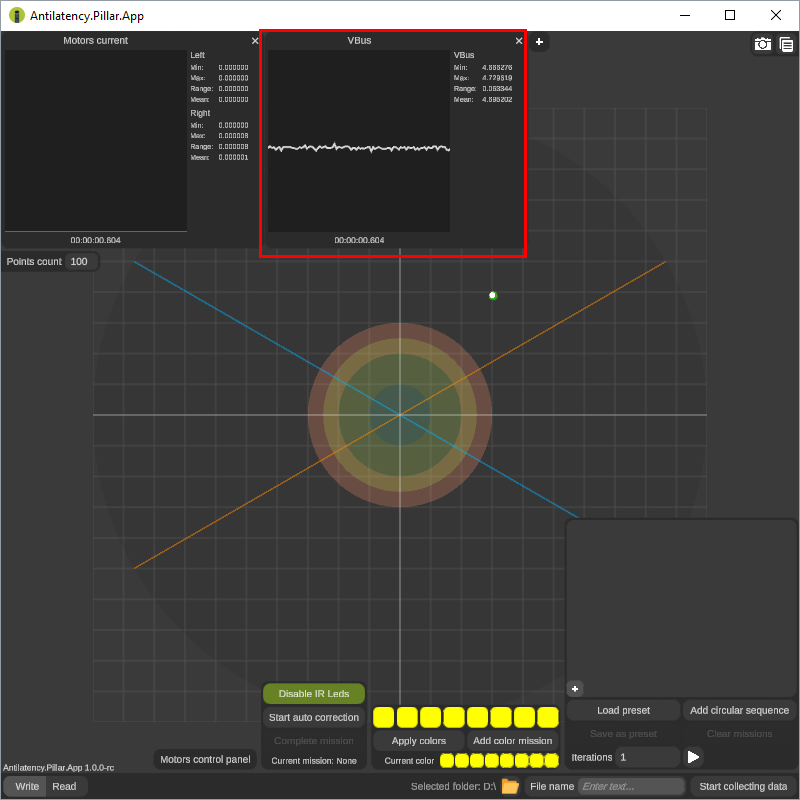
The Connect pillar node to start receiving data message at the bottom of the screen signals the lack of contact between your device and Antilatency Pillar. Make sure that the USB cable is connected properly and check the operability of the port itself. Also, check if Antilatency Pillar is occupied by another app or program, and make sure the firmware version of your pillar is 3.0.0.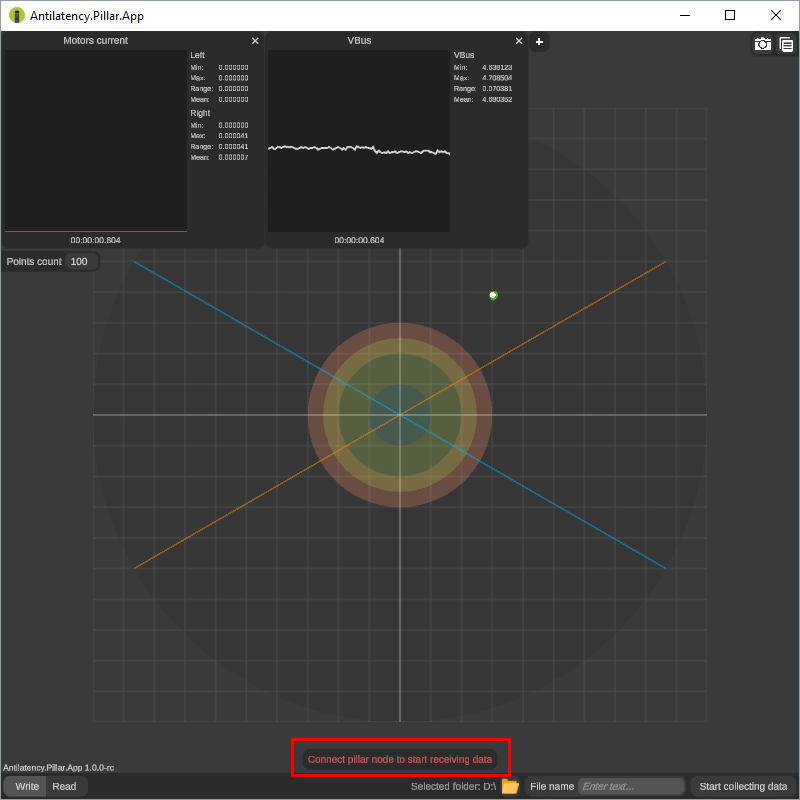
User interface
Antilatency.Pillar.App comes with a simple layout. The main area is a field with circular zones and intersecting axes. Circular zones are necessary to visualize the deviation of a magnet from the center: a magnet is in the center if a marker is in the center of the dark green zone, and therefore a pillar itself is in an upright position. If a marker is in the red zone or outside the field, it signals a significant deviation of a magnet.
Two interactive windows located on the top left-hand side show current intensity in the motors of a pillar alignment mechanism and output voltages produced from a USB port respectively.
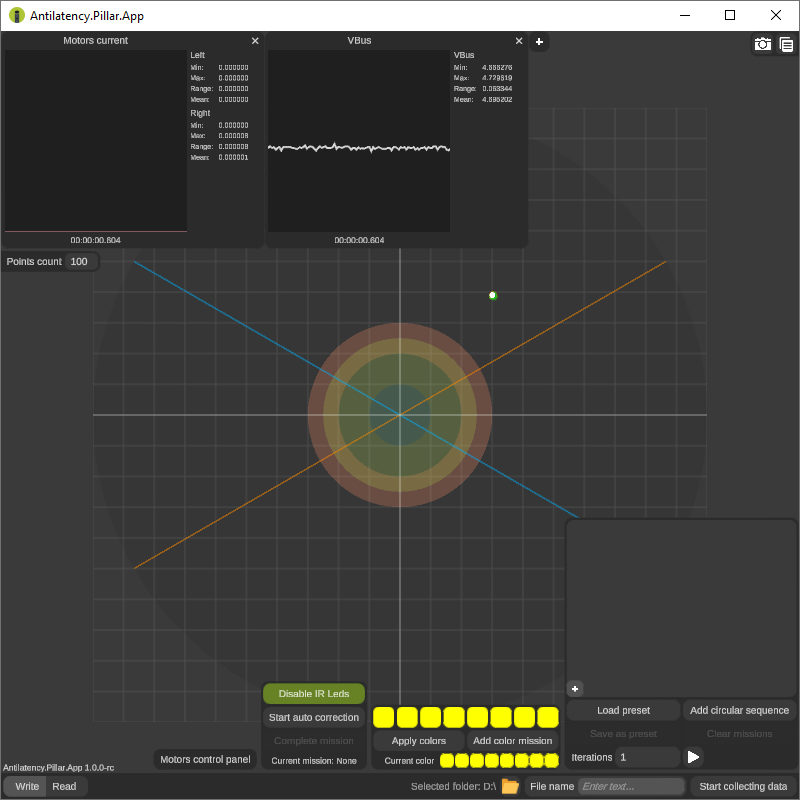
A command area on the lower half of the screen is for diagnostics and configuration of the pillar systems.
Use the Write and Read buttons located in the lower left-hand corner of the screen to switch between the Write (this mode is used for data collection) and Read (this mode is used for data analysis) modes.
Diagnostic data collection
There are two diagnostic scripts a user can choose from to collect information for later analysis:
Calibration malfunction diagnostics
Follow these steps to collect the data necessary:
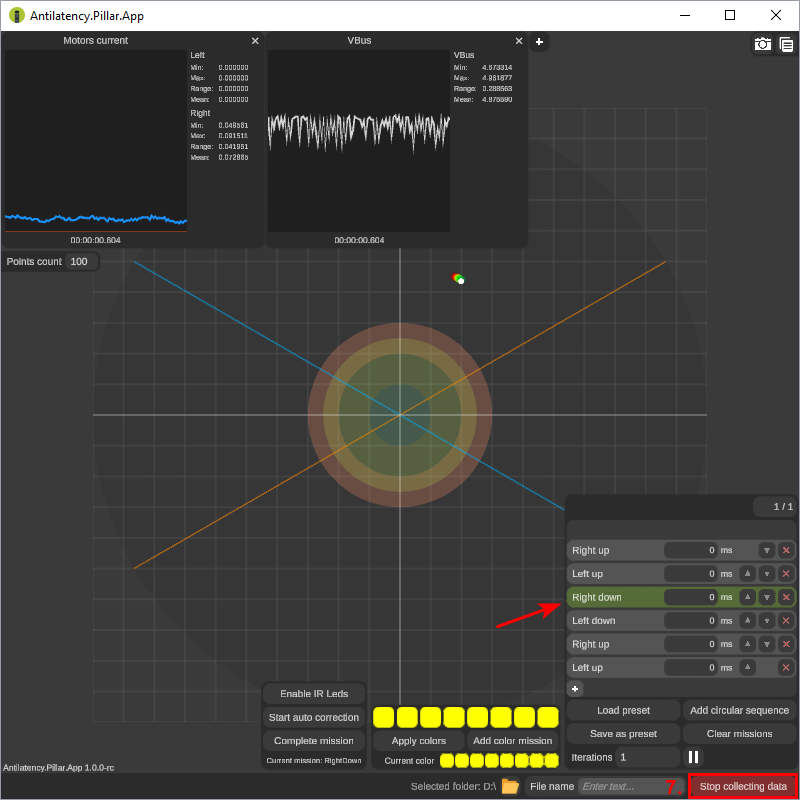
- Click on the Folder icon in the lower part of the screen and choose a place to save the collected data to. Avoid making any changes in the File name input box.
- Click on the Disable IR Leds button to disable the IR markers of a pillar. This action is optional and needs to be done if the output voltages produced from the USB port exceed the recommended values.
- Click on the Add circular sequence button.
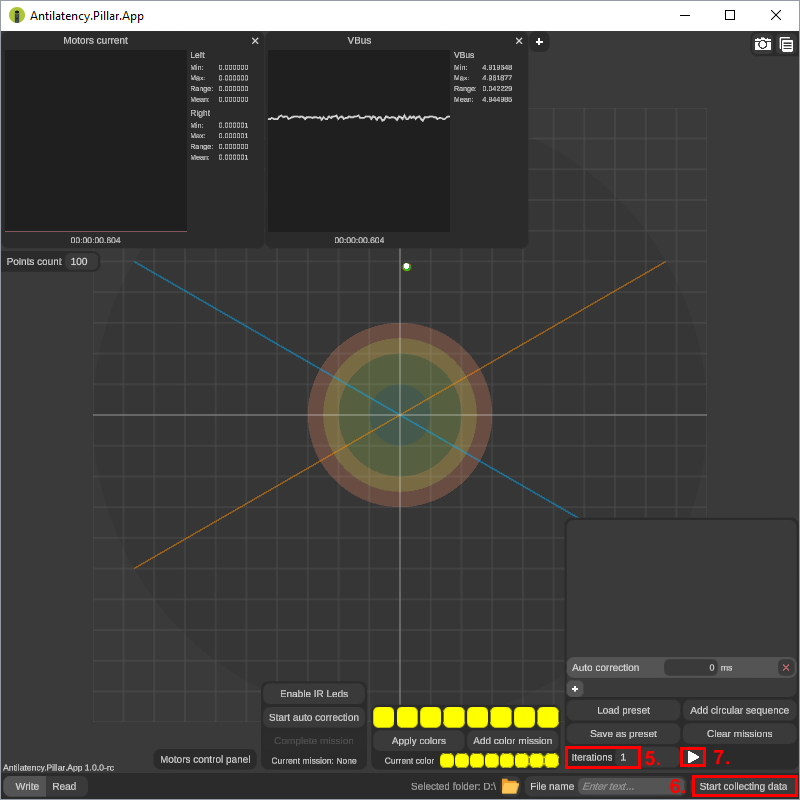
- Set a number of iterations in the Iterations input box.
- Click on the Start collecting data button.
- Then click on the Play button.

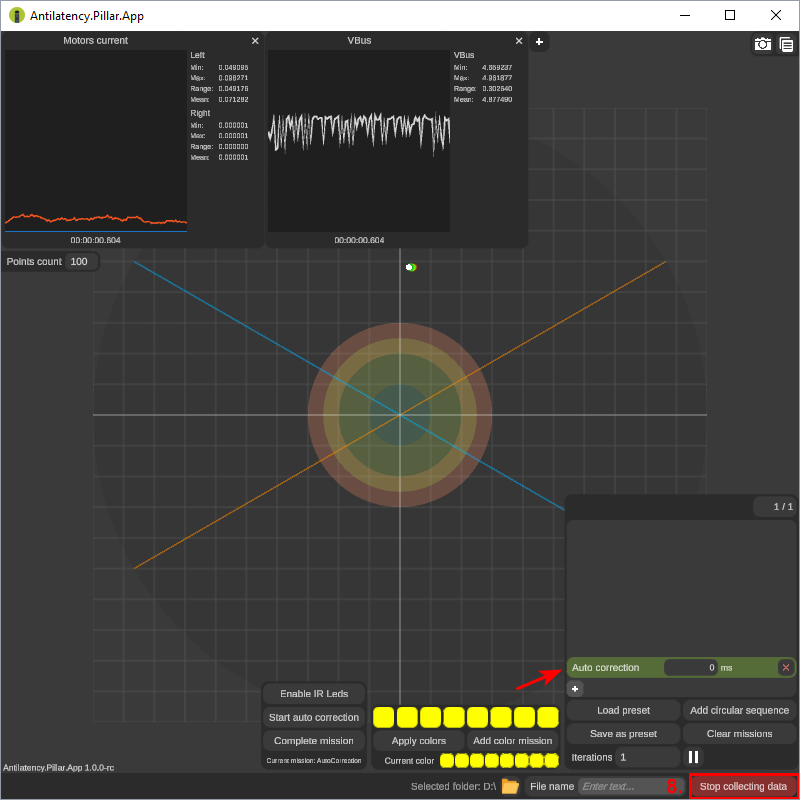
- Wait for the data collection process to finish (the operation that is currently being performed is highlighted in green) and click on the Stop collecting data button.
- The diagnostic data have been collected, saved to a separate file, and ready for later analysis.
The image obtained as a result of running a diagnostic process.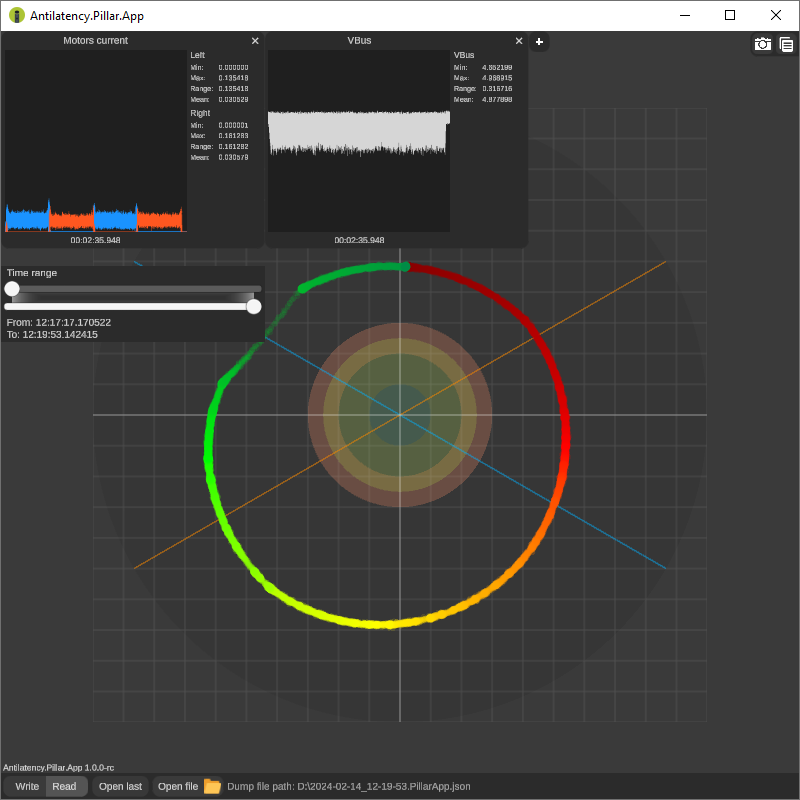
Diagnostics of automatic alignment system
Follow these steps to collect the data necessary:
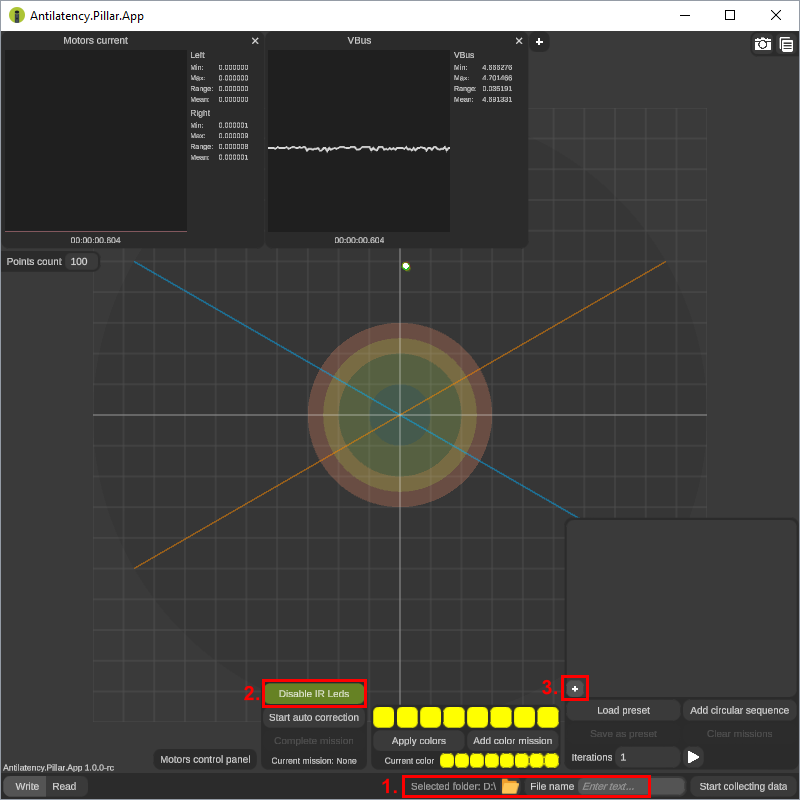
- Click on the Folder icon in the lower part of the screen and choose a place to save the collected data to. Avoid making any changes in the File name input box.
- Click on the Disable IR Leds button to disable the IR markers of a pillar. This action is optional and needs to be done if the output voltages produced from the USB port exceed the recommended values.
- Click on the + button.
- Select Auto correction.
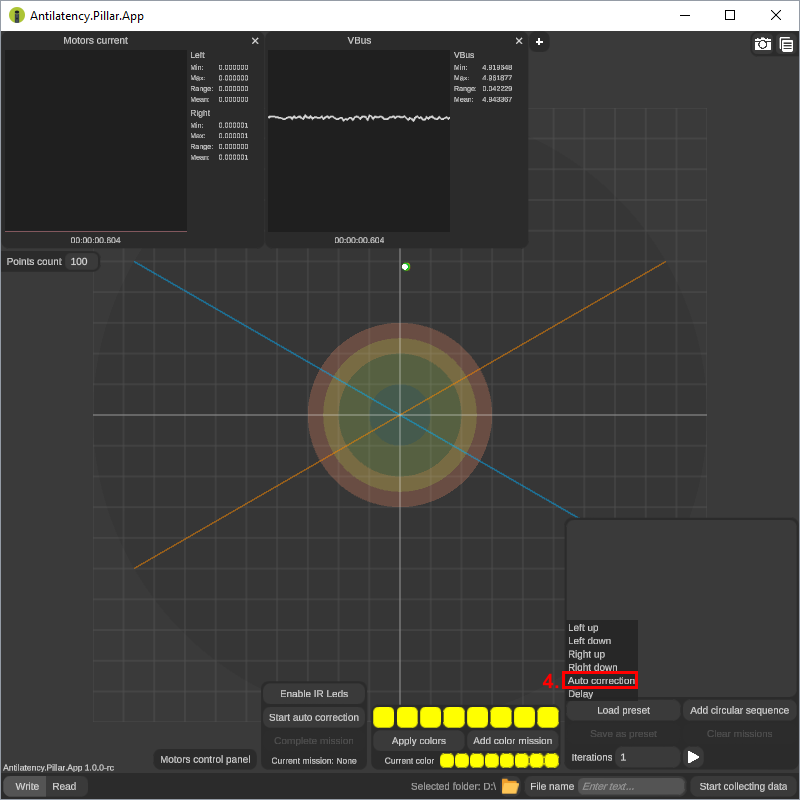
- Set a number of iterations in the Iterations input box.
- Click on the Start collecting data button.
- Then click on the Play button.
- Wait for the data collection process to finish (the operation that is currently being performed is highlighted in green) and click on the Stop collecting data button.
- The diagnostic data have been collected, saved to a separate file, and ready for later analysis.