HorizontalGrid Environment Tracking Area Quality Assessment
This section describes HorizontalGrid Environment tracking area quality assessment tools.
Environment quality assessment tools
The Environment quality is an integral assessment of the layout. It takes the quality of tracking, the quality of features and "blind spots" into account. Various view modes are used to assess the quality.
Environment view modes
The following Environment view modes are available (taking into account the current simulation parameters):
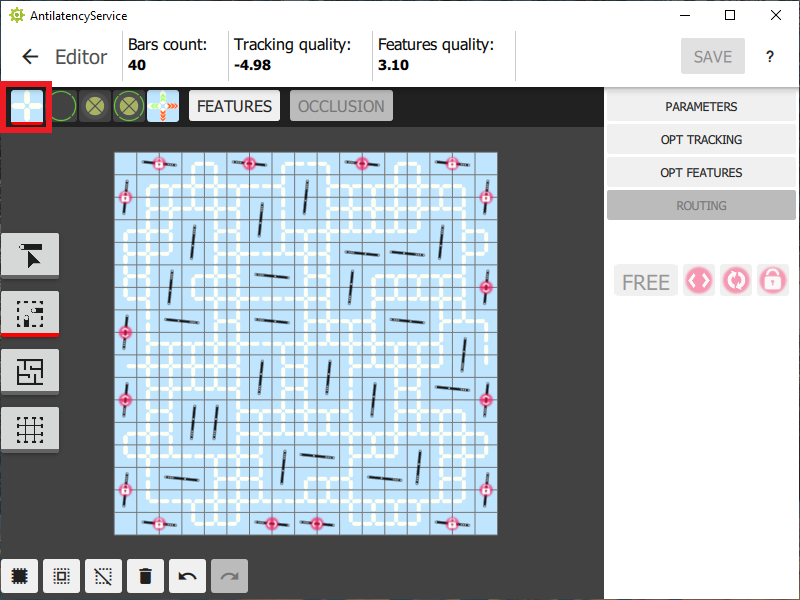
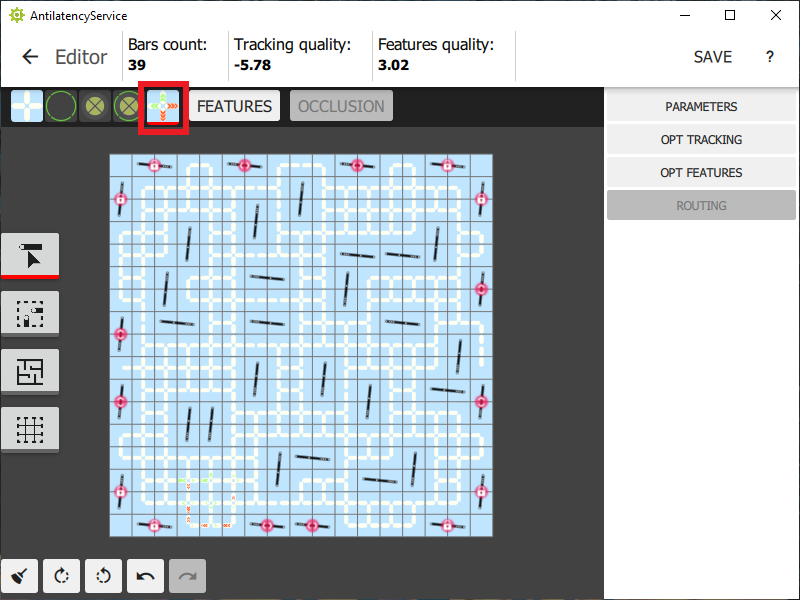
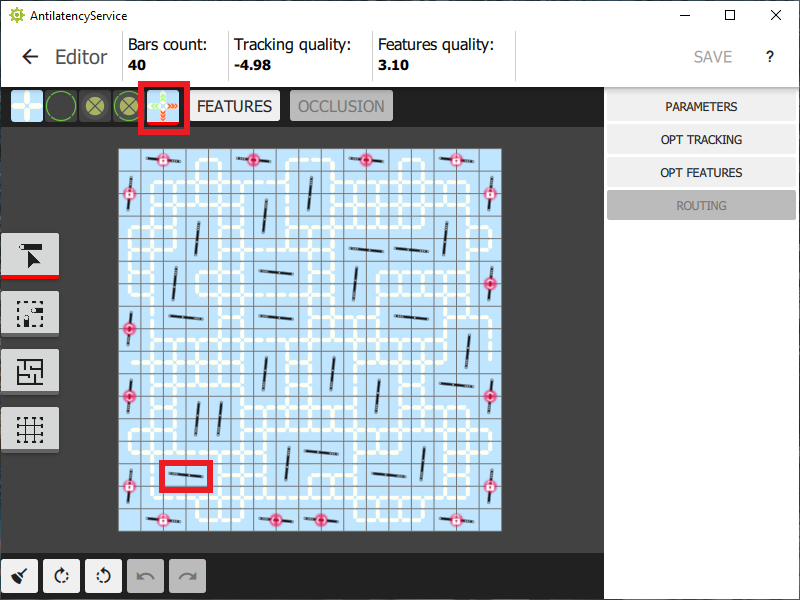
1. all possible locations of the reference bars (shown in white outline in the layout);
The available placement options for the reference bars depend on the Environment type. This section uses images of the ceiling tracking area.
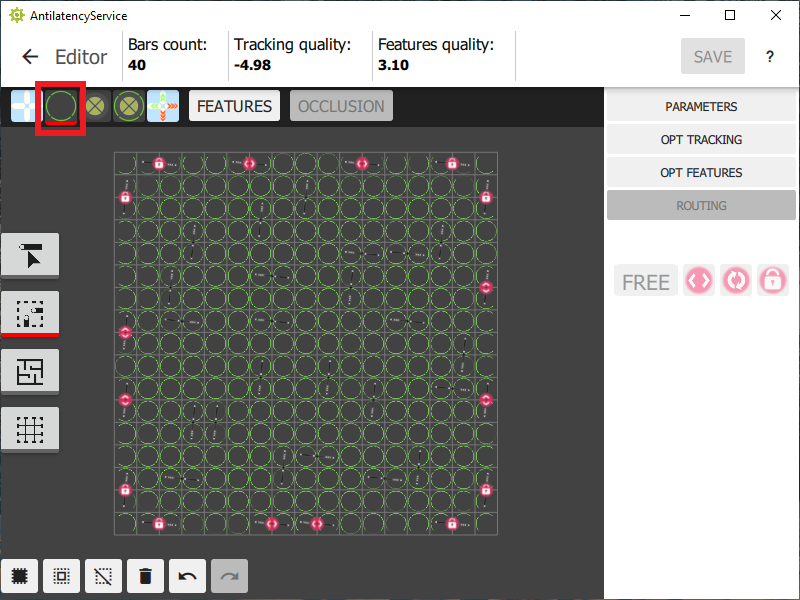
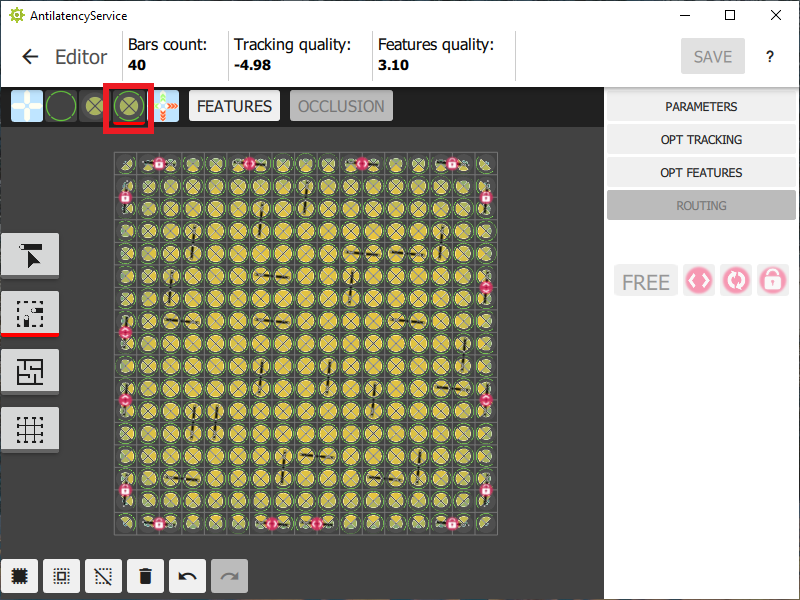
2. visibility of features in a certain cell: each Environment cell will display circles divided into 4 arcs. The brighter the arc is, the higher is the feature quality in this direction;
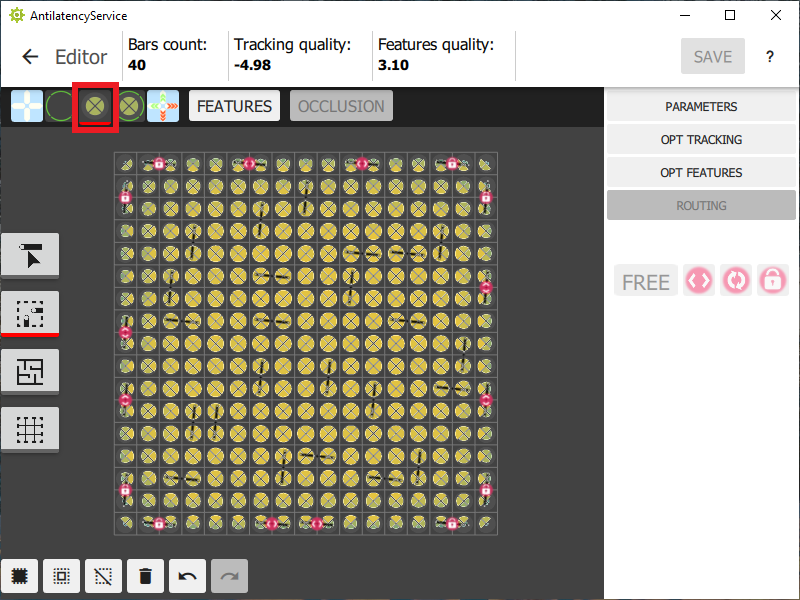
3. tracking quality: a pie chart will appear in each Environment cell, divided into 4 segments. The larger and brighter segment means the higher tracking quality in that direction. The smaller segment means lower tracking quality and less stability;
Negative numbers of «Tracking quality» on the panel at the top of the window are simply values in conventional logarithmic units, not "bad tracking". An increasing value of this metric indicates an improvement in the quality of tracking.
4. the features quality and the tracking quality simultaneously;
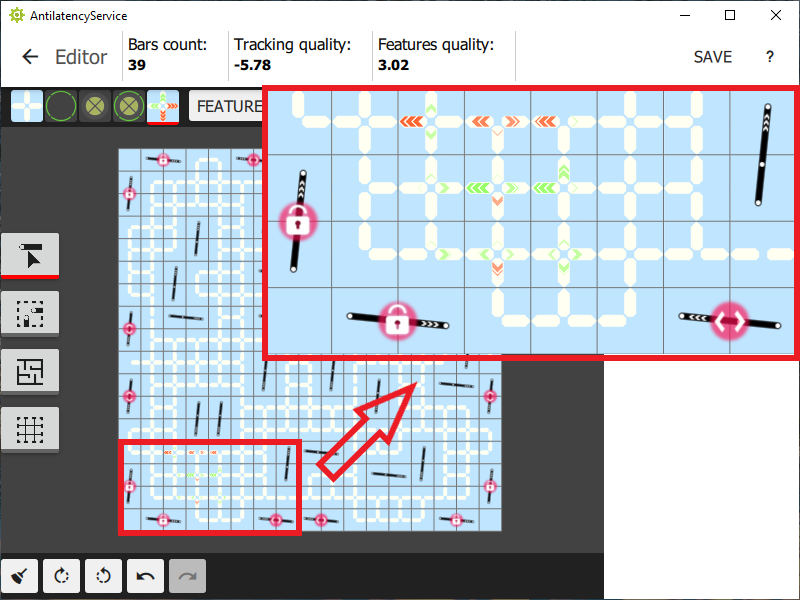
5. options for moving reference bars to improve the features quality. The mode is activated after deleting one or more reference bars, as shown below: HorizontalGrid Environment Tracking Area Quality Assessment;
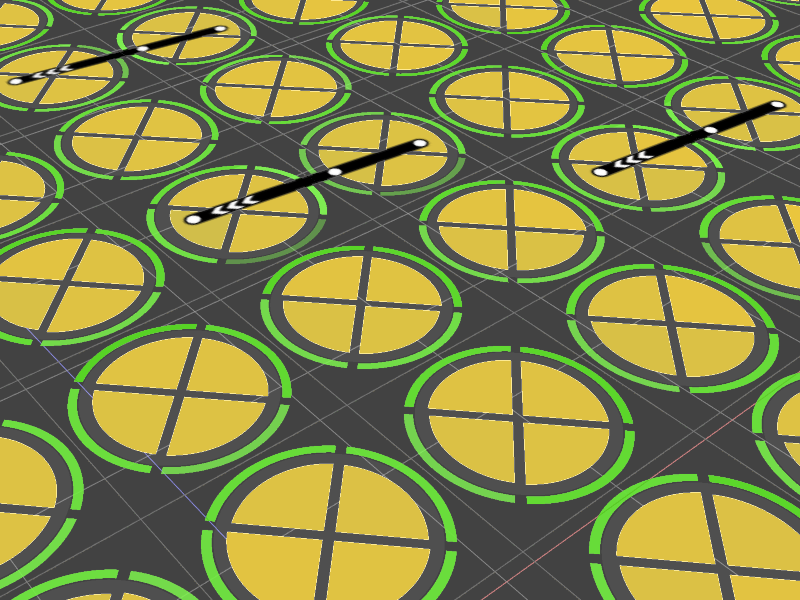
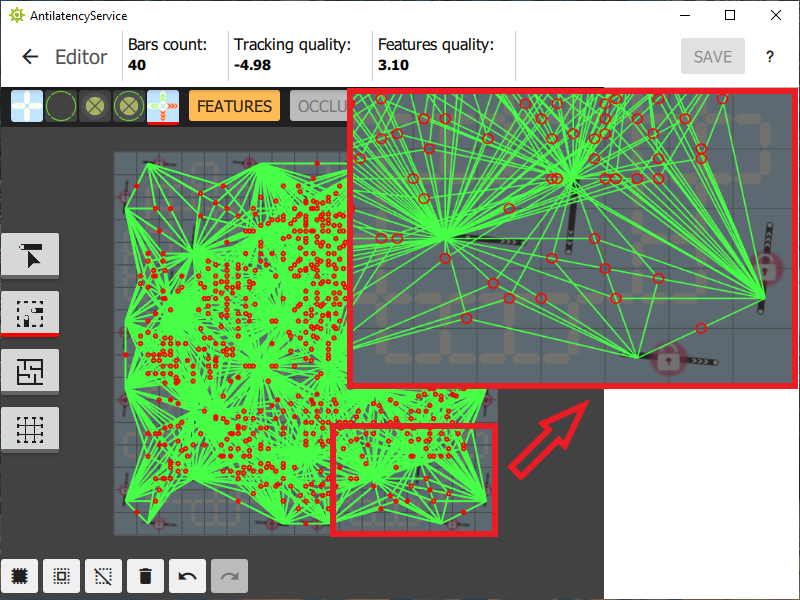
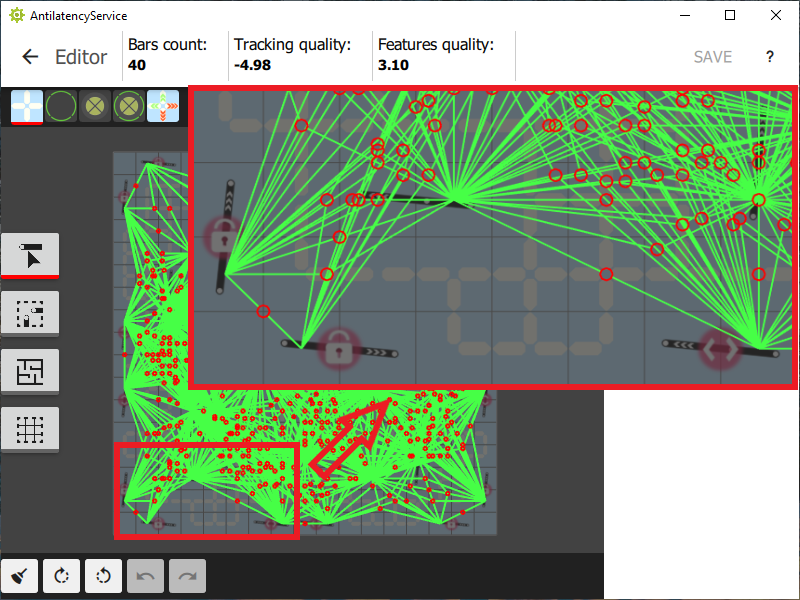
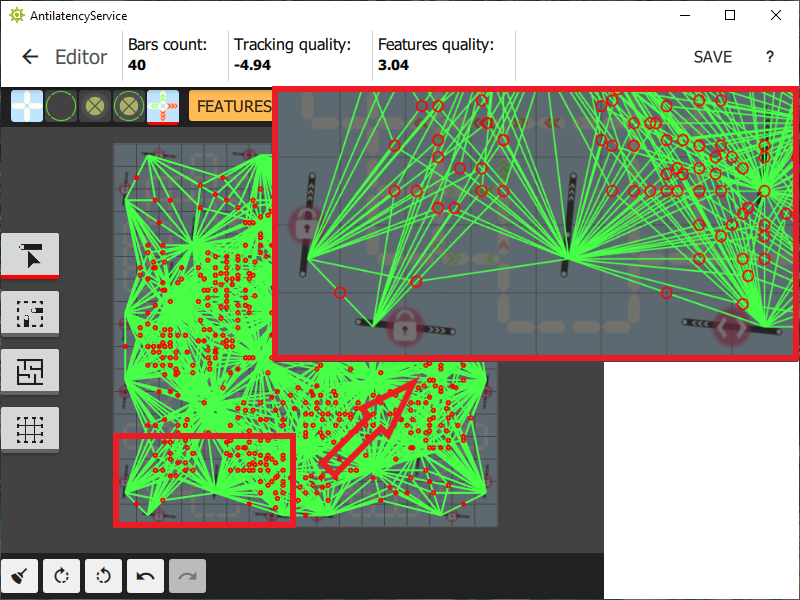
6. current features (marked with red circles). Reference bars that form features are connected with green lines;
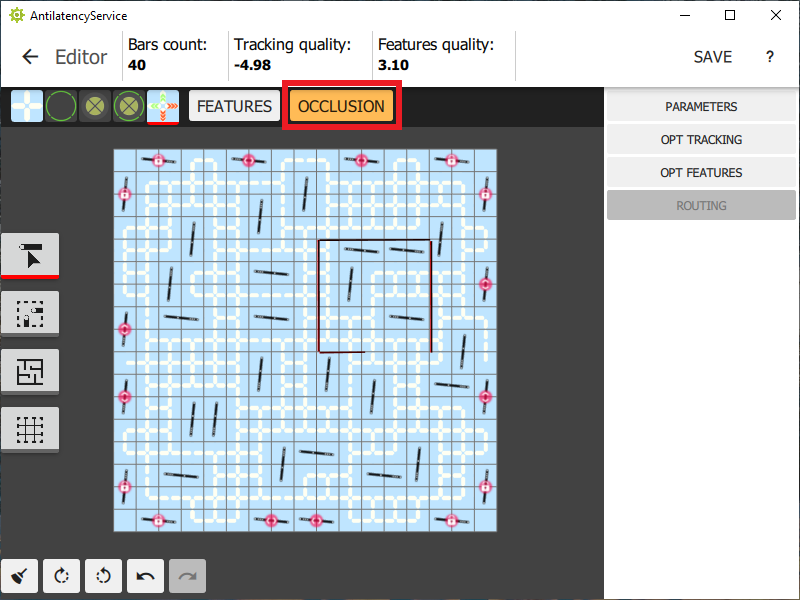
7. existing occlusions within the tracking area.
For more information on the structure and parameters of the Environment, refer to the article.
Manual Environment quality adjustment
The automatic optimization of the tracking and the features quality should provide efficient operation of the tracking area. However, if you wish, you can manually correct the location of certain reference bars.
Suppose our ceiling tracking area includes 40 reference bars. After optimization, the reference bars will be arranged to provide the highest quality of features with the highest possible tracking quality. However, in borderline areas, feature visibility is not high enough.
Let's take the following example and try to correct the bottom of our Environment. There are no features within some cells of the selected rectangle. This means that you need to manually correct the location of the reference bars in this part of the Environment.
Let's switch to the bar movement options view mode.
Double-click on this reference bar to delete it. The system will automatically evaluate all placement options for reference bars. Optimal placement is marked with green indicators with the maximum number of segments. Installing the raference bars in cells with red indicators is undesirable, because it will lead to a decrease in the quality of tracking and features.
Let's choose a vertical placing of the reference bar on the layout. Thanks to this, the overall quality of tracking and features has improved.
Similarly, you can adjust the location of reference bars in the rest of the borderline areas. After that, you can save the Environment and move on to the next step — creating a routing scheme.